(This article provides an insight on the Personal Income Tax structure in Sri Lanka as the second part of a series discussing potential tax reforms.)
Raising government revenue is critical for Sri Lanka to recover from the current economic crisis and create a more sustainable economic environment. However, taxes should be paid by those who can bear the burden.
Personal Income Taxes (PIT) is an effective instrument in generating revenue as well as in reducing inequality through revenue redistribution. In Sri Lanka, there has been a steady decline in revenue from PIT from 0.9% of GDP in 2000 to 0.2% of GDP in 2022. Revenue collection is lower than that of even other low income economies. Furthermore, PIT tax revenue as a percentage of direct tax revenue declined from 40% in 2000 to 9.3% in 2022, although GDP per capita increased from USD 869 in 2000 to USD 3,474 in 2022.
Advanced economies raise approximately 9% of GDP from PIT, while emerging economies and low income economies raise only 3.1% and 2.1% of GDP, respectively. Sri Lanka reports the lowest contribution of PIT as a percentage of GDP in 2021, both among advanced economies in Asia such as South Korea, as well as developing economies such as Bangladesh, Malaysia and Vietnam (See Figure 1).
Figure 1: Performance of Personal Income Tax Collection among Selected Countries
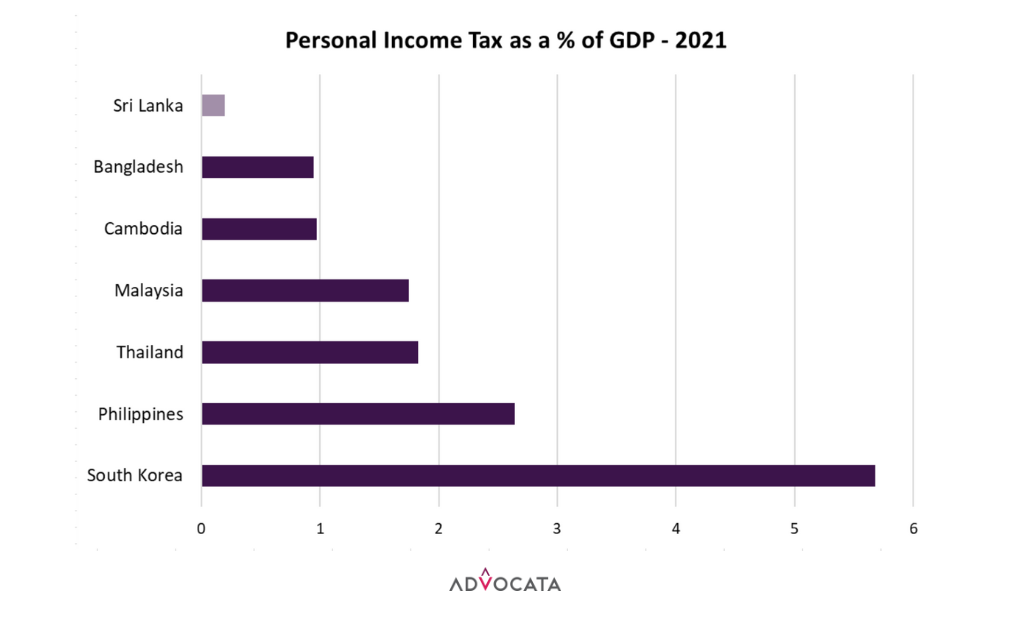
Source : IMF Data Library, OECD
Narrow Tax Base
The narrow tax base is one of the main reasons for Sri Lanka’s low PIT revenue performance. A narrow base not only limits revenue generation but it also makes revenue collection reliant on a small segment of the population.
The number of income tax payers under the Pay As You Earn (PAYE)/Advanced Personal Income Tax (APIT) Scheme as a percentage of the total employed population shows a relatively small proportion of the workforce contributing to income taxes (see Table 1). In 2019, the proportion of tax paying employees was 33%. This proportion declined to less than 1% in 2021 due to abolishing of PAYE taxes with effect from 1st January 2020. A voluntary APIT System was introduced with effect from April 1, 2020, where employees can opt in. This shift not only led to a revenue decline but also created monitoring gaps. With effect from January 1, 2023, it was mandated for employers to deduct APIT from employees’ income, reverting to the original PAYE scheme.
Table 1: Employee Contribution to PIT
| 2019 | 2020 | 2021 | 2022 | |
| Total Employed Population | 8,180,693 | 7,999,093 | 8,113,507 | 8,147,731 |
| Formal Employees | 3,482,505 | 3,352,613 | 3,377,780 | 3,469,040 |
| Informal Employees | 4,698,187 | 4,646,480 | 4,735,727 | 4,678,690 |
| Total Non Corporate Taxpayers | 1,449,092 | 975,293 | 341,805 | 259,869 |
| o/w Employees paying Income Tax under PAYE/APIT | 1,149,883 | 209,800 | 32,702 | 41,636 |
| % of PAYE/APIT tax payers to total employees | 14% | 2.6% | 0.4% | 0.51% |
| % of PAYE/APIT tax payers to total formal employees | 33% | 6.26% | 0.97% | 1.2% |
Source: IRD Performance Reports, Labour Force Survey
The large informal sector also contributes to the narrow tax base and low PIT performance. According to the Labor Force Survey 2022, the informal sector accounts for around 58% of total employment (see Table 1). A large portion of the economy operating outside formal regulation enables tax evasion and avoidance. Transforming the current informal self-employment system to a modern formal employee-employment system would be one way to improve tax revenue collection.
Two alternative recommendations are proposed to capture informal economic activities into the tax net. Establishing a universal online payments system would reduce cash transactions in the economy enabling better monitoring; and secondly, by introducing a unique digital identification system that connects tax accounts with income sources, bank accounts, motor vehicle and land registration etc. Authorities could cross check information provided in income tax returns as well as identify individuals who do not file returns.
Tax Free Threshold and Tax slabs/Brackets
In the recent amendment to the Inland Revenue Act, the tax free threshold for income was reduced from Rs.3 million per annum to Rs.1.2 million per annum. Further, the tax brackets were reduced from Rs.3 mn to Rs.0.5 million. Accordingly, the incremental tax rate for each additional Rs. 0.5 million of income was set at 6% (see Table 2).
Table 2: Tax Threshold and Tax Brackets
| Tax Free Threshold Per Annum | Tax Brackets Range | Marginal Income | Rates |
|
1,200,000 |
500,000 | 1,700,000 | 6% |
| 500,000 | 2,200,000 | 12% | |
| 500,000 | 2,700,000 | 18% | |
| 500,000 | 3,200,000 | 24% | |
| 500,000 | 3,700,000 | 30% | |
| 500,000 | >3,700,000 | 36% |
Source :Inland Revenue (Amendment) Act, No. 4 of 2023
Applying the current tax free threshold, income taxes are applicable to approximately the top 15% of households where around 36% of total income is concentrated (see figure 2).
Figure 2: Share of Income by Population 2019
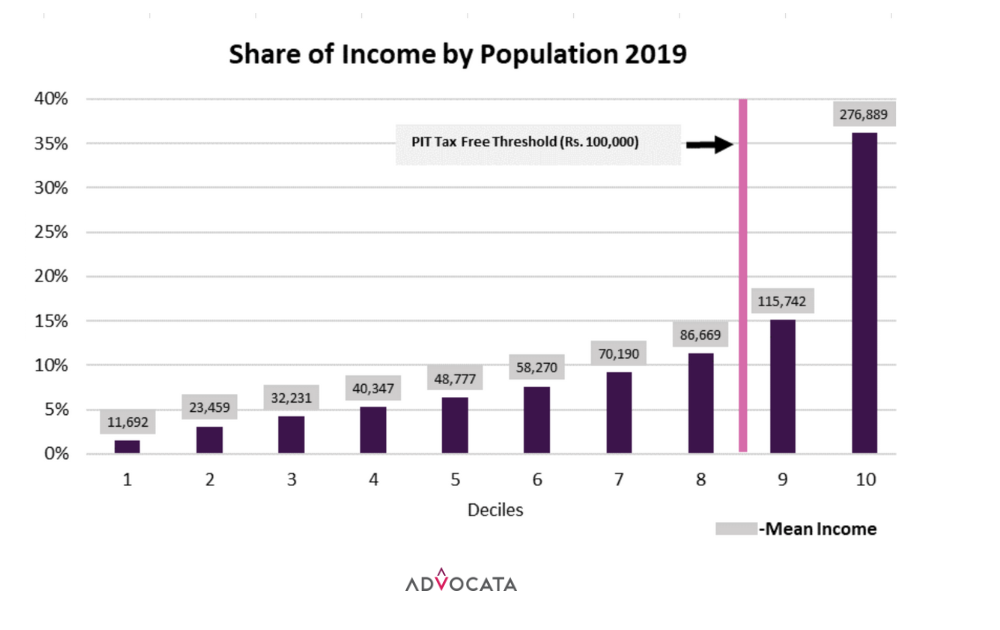
Source : HIES Survey Annual Report 2019
According to the national poverty line for July 2023, the minimum monthly expenditure per person required to meet basic needs is Rs. 15,978. Hence, the total cost for a family of four is approximately Rs. 65,000 per month. Assuming salaries and wages remain unchanged at 2019 levels, more than two-thirds of income is spent by households up to the 9th decile, (see Table 3). Any additional financial burden including income taxes could further reduce the disposable income of households up to the 9th income decile. Hence, information on household income and expenditure patterns must be considered when setting income tax thresholds.
Table 3 : Mean Household Expenditure as a % of Mean Household Income
| Decile Group | Mean Income (Rs) | Mean Expenditure (Rs) | Mean Expenditure as a % of Mean Income |
| 1 | 11,692 | 18,447 | 158% |
| 2 | 23,459 | 27,517 | 117% |
| 3 | 32,231 | 33,303 | 103% |
| 4 | 40,347 | 38,843 | 96% |
| 5 | 48,777 | 45,576 | 93% |
| 6 | 58,270 | 51,675 | 89% |
| 7 | 70,190 | 58,729 | 84% |
| 8 | 86,669 | 70,696 | 82% |
| 9 | 115,742 | 89,039 | 77% |
| 10 | 276,889 | 144,844 | 52% |
Source : HIES Survey Annual Report 2019
Although the current tax system applies differential tax rates based on income brackets, an analysis of the effective tax rates paid within these brackets indicates a less than progressive tax system. An individual crossing the tax free threshold of Rs.1.2 million per annum (equivalent to a monthly income of Rs. 100,000) pays an effectives tax rate of 1%, which gradually increases to 12% until the highest income bracket is reached at over Rs. 3.7 million (which is equivalent to a monthly income of Rs. 308,333). All the income levels above this income would be taxed at the highest nominal marginal rate of 36%. However, after a particular income level the effective tax rate flattens (see Table 4). This implies that individuals in the highest income categories effectively pay less taxes. Expanding the income tax brackets would introduce more fairness and progressivity into the tax system.
Table 4 : Effective Rate of Tax
| Monthly Income | Annual Income | Effective Rate of Tax |
| 108,333.33 | 1,300,000 | 0.5% |
| 141,666.67 | 1,700,000 | 2% |
| 183,333.33 | 2,200,000 | 4% |
| 225,000.00 | 2,700,000 | 7% |
| 266,666.67 | 3,200,000 | 9% |
| 308,333.33 | 3,700,000 | 12% |
| 316,666.67 | 3,800,000 | 13% |
| 333,333.33 | 4,000,000 | 14% |
| 416,666.67 | 5,000,000 | 18% |
| 500,000 | 6,000,000 | 21% |
| 750,000 | 9,000,000 | 26% |
| 1,000000 | 12,000,000 | 29% |
| 2,500,000 | 30,000,000 | 33% |
| 5,000,000 | 60,000,000 | 35% |
| 7,500,000 | 90,000,000 | 35% |
| 10,000,000 | 120,000,000 | 35% |
| 12,500,000 | 150,000,000 | 35% |
Source : Author’s Calculation
Figure 3: Personal Income Tax as a percentage of Annual Income
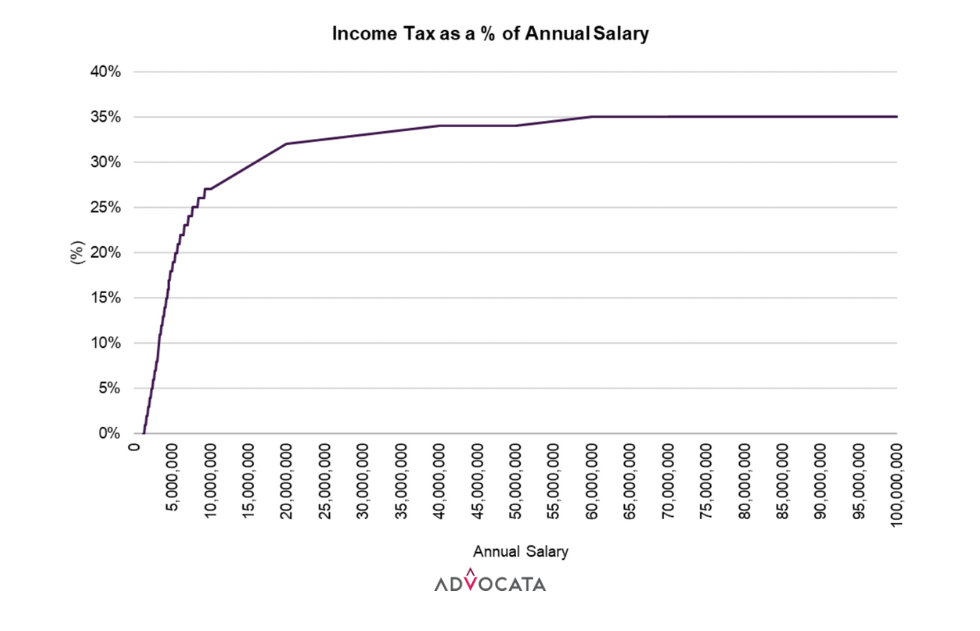
Source : Authors’ Calculation
The fairness of the tax system is further exacerbated as those whose main income sources are subject to capital gains are taxed at only 10% versus those whose income are subject to PIT who are taxed at a higher rate of 36%.
As wages and salaries rise to keep up with inflation, individuals may find themselves earning more in nominal terms, but their purchasing power remains relatively unchanged. Adjusting thresholds for inflation ensures that employees are not disproportionately burdened by bracket creep where taxpayers are pushed into higher brackets due to inflation. A proper rationale and scientific basis for determining thresholds, tax slabs, and tax rates is needed to increase revenue collection and ensure fairness in the tax system.Also, the proposed tax system should generate the estimated tax revenue by the end of the year.
Frequent ad hoc policy changes
Tax policy is frequently subjected to change, without proper economic rationale. For instance, the tax slabs for PIT have been revised 9 times while the tax free threshold was revised 5 times since 2000. Frequent and ad hoc policy changes complicate tax administration and reduce tax compliance.
Conclusion
The country has failed to meet the first quarter targets for revenue under the IMF’s Extended Fund Facility Program. Raising government revenue will be critical to remaining within the program. Improving revenue collection from income taxes will be critical to achieving the revenue targets, while broadening the tax base will ensure the burden of taxation falls on the broadest shoulders.
Roshan Perera is a Senior Research Fellow at Advocata Institute. She can be contacted via roshananne@gmail.com. Thashikala Mendis is a Data Analyst at Advocata Institute. She can be contacted via thashikala@advocata.org. Janani Wanigaratne is a Research Consultant at Advocata Institute. She can be contacted via janani.advocata@gmail.com.
The opinions expressed are the author’s own views. They may not necessarily reflect the views of the Advocata Institute or anyone affiliated with the institute.